

Global Economics Q&A: The NBER’s Recession Timing

Some people have asked about the NBER’s official call on recessions. As I mentioned in “Recession Obsession”, in the United States, the National Bureau of Economic Research (NBER) officially calls our recessions. You can find their explanations and announcements here: https://www.nber.org/research/business-cycle-dating
But it’s not clear what they exactly look at. So let’s look at the NBER’s own statements and some graphs. I hope this helps!
The NBER’s Own Explanations
They have an FAQ section (https://www.nber.org/business-cycle-dating-procedure-frequently-asked-questions ) which is where I’m getting everything here in italics and quotes.
“What is a recession?”
Answer: “The NBER's traditional definition of a recession is that it is a significant decline in economic activity that is spread across the economy and that lasts more than a few months. The committee's view is that while each of the three criteria—depth, diffusion, and duration—needs to be met individually to some degree, extreme conditions revealed by one criterion may partially offset weaker indications from another.”
And, the second question people tend to have is here:
“What indicators does the committee use to determine peak and trough dates?”
Answer: “The determination of the months of peaks and troughs is based on a range of monthly measures of aggregate real economic activity published by the federal statistical agencies. These include real personal income less transfers (PILT), nonfarm payroll employment, real personal consumption expenditures, wholesale-retail sales adjusted for price changes, employment as measured by the household survey, and industrial production. There is no fixed rule about what measures contribute information to the process or how they are weighted in our decisions.”
I especially love that last line “There is no fixed rule about what measures contribute information to the process or how they are weighted in our decisions.” Thanks! Very helpful.
This is what I explained before. There’s not really a solid definition of a recession. It definitely isn’t two consecutive quarters of negative GDP.
To get a feel for some quick and easy things to look at, let’s look at a few graphs. We’ll use FRED graphs again. One of the reasons I like the FRED graphs are because they automatically include the grey shaded areas to indicate the NBER’s officially recognized recession periods. We can see what was happening in reality and when they dated past recessions.
FRED Graphs: First Let’s Look at GDP
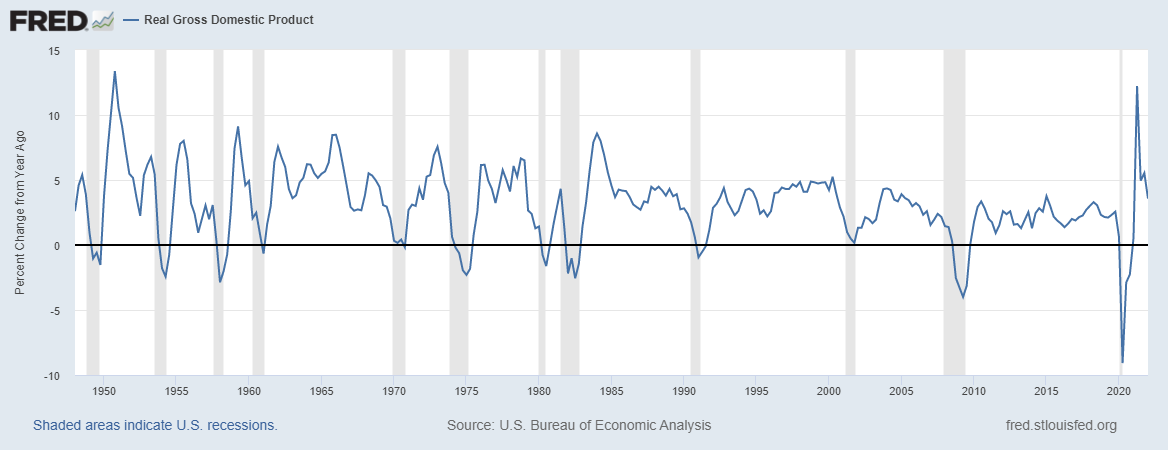
This is a graph of real GDP’s year-over-year change. This helps because now GDP’s change above the zero line is positive and below the zero line is negative.
A first observation just from a quick look is that the recessions around 1960, 1970, maybe 1990, and 2001 don’t look like two quarters of negative GDP growth. Period.
Second, it is often the case, however, that GDP does go negative and usually for a while so we can see where the two-quarters-of-negative-growth idea comes from.
Third, if you just compare things from before 1982 to after 1982, the 1947-1982 period looks more volatile than the post 1980 period. That is, the growth rate was way more erratic until 1982. Many monetary economists believe that is because we improved monetary policy. The flattering view is that we figured out how to conduct monetary policy to maintain growth while keeping low inflation (not pictured here). The less flattering view is that we figured out we were messing things up and learned to be more careful. Sort of like a physician, the first rule for monetary authorities is “do no harm”.
It's not actually clear why things are less erratic, by the way. But that’s a discussion for another time.
Fourth, no matter how you cut it, the 2008 recession and the Covid recession were massive. They were like earthquakes that shook the foundations of the economy. While Covid was caused by non-policy factors, most economists (monetary and otherwise) believe that at some level bad economic policy and bad monetary policy in particular led to the 2008 recession. If that’s true, we broke the first rule of “do no harm”.
And that’s honestly the worry again today. If easy money led to risky investments and the financial crisis, are we doing the same today post-Covid?
It’s Unemployment First and GDP Growth Second

This is the year-on-year change in the unemployment rate (red) included in the same graph with year-on-year GDP growth (blue). It’s very clear from this that unemployment is the deciding factor.
One trick with economic data is to remember that in the heat of the moment, the Fed and the NBER don’t know the actual numbers. When we use graphs like the one above we are looking at data that has been cleaned and corrected over many years.
Because all economic data is aggregated and estimated from samples, we never know the “true” numbers of anything. And just think for a moment about how long it takes the government statisticians to gather samples of data from enough people to have a feel for what unemployment actually is, what inflation is, GDP is, and also calculate all the other things they look at. They do samples, calls, check data and reports from businesses and so on, then use all that to get as accurate an estimate as they can. But it’s then adjusted and corrected for months. Now imagine how quick and how accurate that was before computers!
This is why turns in the economy are so hard to predict. All statistical estimations are based on historical data and trends, but when everyone suddenly changes all their purchasing patterns – like we did during Covid – statisticians have to change the way they collect all their data, change their models, etc.
Anyway, the main lesson from the above graph is this: It’s unemployment first and GDP growth second that matters. You can just see it. Every recession is characterized by a major increase in the unemployment rate.
Current Numbers

I waited for our current graph. And there are two lessons I want you to take away. First, again, the numbers are crazy for Covid. Both the drop in GDP and the spike in unemployment. And behind that was a massive shifting around of work patterns, people leaving the work force, people buying goods online instead of services locally and a million other things.
Second, you can see that unemployment is nowhere near “recession levels”, if it’s an accurate and meaningful number at all.
Please notice that the above graph is all percentage change from a year ago. That means when unemployment rose from 3% to 14%, that change is a 367% increase in the unemployment rate. It doesn’t mean that unemployment hit 367%. I left this scale so you could see clearly what drove those periods being classified as recessions.
A Final Look at the Data
Next let’s look at the data with GDP growth in blue and the actual unemployment rate in red.

The basic lessons are the same but it’s harder to see that the red line drives the recessions. It’s still there, but you have to look more closely.
And let’s immediately zoom into the recent data in this graph. Our focus is on the last part of the graph.

First, you can see that unemployment isn’t rising yet. And if we compare the year over year change, it still isn’t rising because the year before it was so high. So by every measure unemployment is still falling (i.e., improving).
Second, GDP growth isn’t negative! What about the concerns around negative first quarter GDP growth? Those numbers are quarter by quarter. GDP grew in Q1 this year compared to last year as you can see (blue line at the end of the graph). But you can see that it grew by less than it did the quarters before. So Q1 this year was down from Q4 last year.
Again, it’s tough to interpret all of this because it dropped so much during Covid and so many other things changed at the same time. So I’ll leave you with one final graph. This is unemployment and labor force participation rate.

Unemployment is still in red (right side axis) but the blue line now is the labor force participation rate (left hand axis). Pre-Covid about 63% of the population was in the labor force either working or looking for work. That dropped to 61% during Covid and is only around 62% now. So where are those people?
If they are returning to work slowly, then our unemployment numbers are way off. But it’s hard to know if they are too high or too low.
Also, it’s hard to know if they aren’t working and are doing fine or not. When they return to the labor force will they add to demand or add to production (supply) more? Which effect is bigger will also affect prices.
Clear as mud, right? Right. And that’s the problem. We’ll watch for the NBER’s official statement, but we’ll be unpacking what is happening today for years to come. It’s a mess. I don’t envy the NBER’s Business Cycle Dating Committee members!