The US Trade Deficit is Getting Worse
The US trade deficit is getting worse and rapidly so. This trend started with Covid and got much worse over the last 12 months.
This isn’t necessarily a problem today but it will be if it continues and bears keeping an eye on. I suspect it will become a bigger topic of conversation because it relates to a number of hot issues: inflation, interest rates, borrowing and debt, and finally government spending.
A First Look at the Trade Deficit
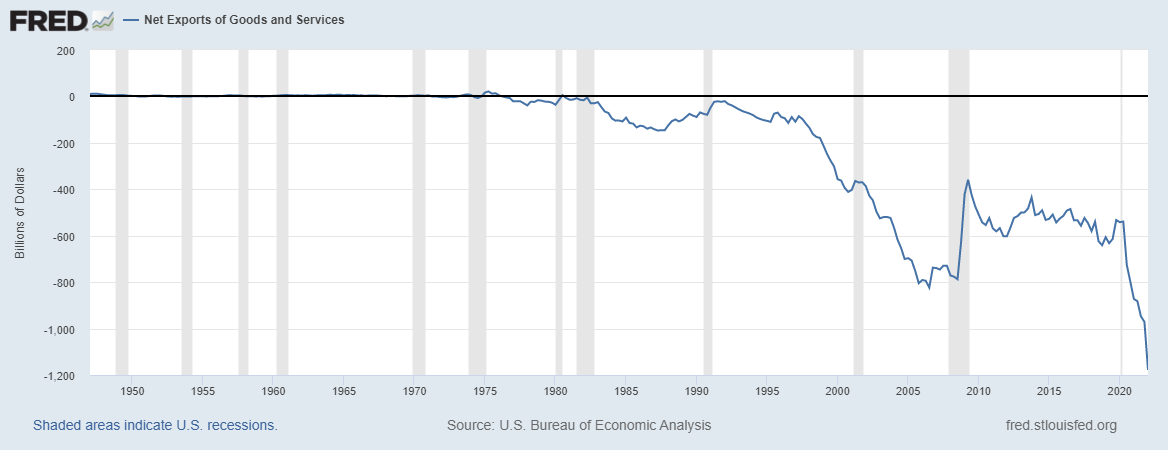
Here’s a graph of US net exports which measures our exports minus our imports from the 1950s all the way until today. And, yes, this graph should disturb anyone who sees it. At the very least it should make you scratch your head.
It’s pretty clear that we’ve imported more than we export since the 1970s. The trade deficit worsened in the 1980s, then improved briefly and took a massive nosedive starting in the late 1990s. That nosedive continued until 2005 when it bottomed out.
The trade deficit reflects the difference between an economy’s income and its spending. It is literally income - spending for the economy as a whole. And for the economy as a whole, income is essentially GDP (total sales of final goods and services production, Y) and spending is captured by consumer spending (consumption, C), business spending on capital and equipment (investment, I) and what the government spends (government expenditure, G)[1]. When spending exceeds income, those goods and the money to buy them must come from outside the economy and that’s what the trade deficit reflects: overall the US economy has been spending more money that it generates and buying more goods than it produces and both the goods[2] and the money to buy them are flowing in from the rest of the world.
The Great Financial Crisis of 2008
From 2005 to 2008 the trade deficit leveled off and then jumped up (i.e., decreased) significantly. That was due to the drop in consumer and investment spending during the financial crisis of 2008. That sudden drop in spending meant less imports and hence a brief improvement in the trade balance. More surprisingly, however, is that it levelled off and stayed fairly constant until the Covid crisis in 2020.
Now, the total net export numbers are a bit misleading because GDP has grown so much since 1950 and that matters when looking at these trends.
To use an analogy, there’s a difference between spending $1,000 a month more than I earn when I’m a student versus when I’m a professor versus when I’m a millionaire. And, to put it all in perspective, even our net exports are larger than our 1950 GDP.
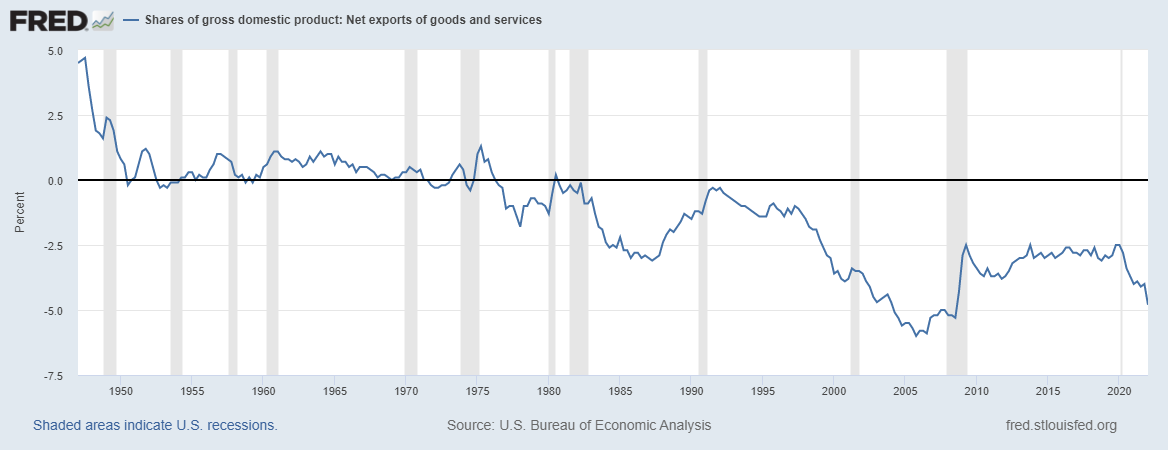
Over the entire time of this graph, from 1947 until today, GDP has grown by 9,927% but net exports declined by 10,934%, so more than GDP grew. Those are hard numbers to wrap our heads around, so we turn to net exports as a percent of GDP.
Once scaled by GDP, we can see more clearly that one big change is that we generally ran trade surpluses (exported more than we imported) until the 1970s. Also, the worst period was the period just before the financial crisis in 2008 (dark shaded area just before the 2010 marker). Since that time, net exports settled around 2.5-3% of GDP until Covid hit in 2020. Net exports continued to worsen ever since, hitting -4.8% of GDP today.
The good news is that as a percent of GDP it’s not quite as dramatic. The bad news is that the declining trend since Covid is still very clear.
Driving Factors
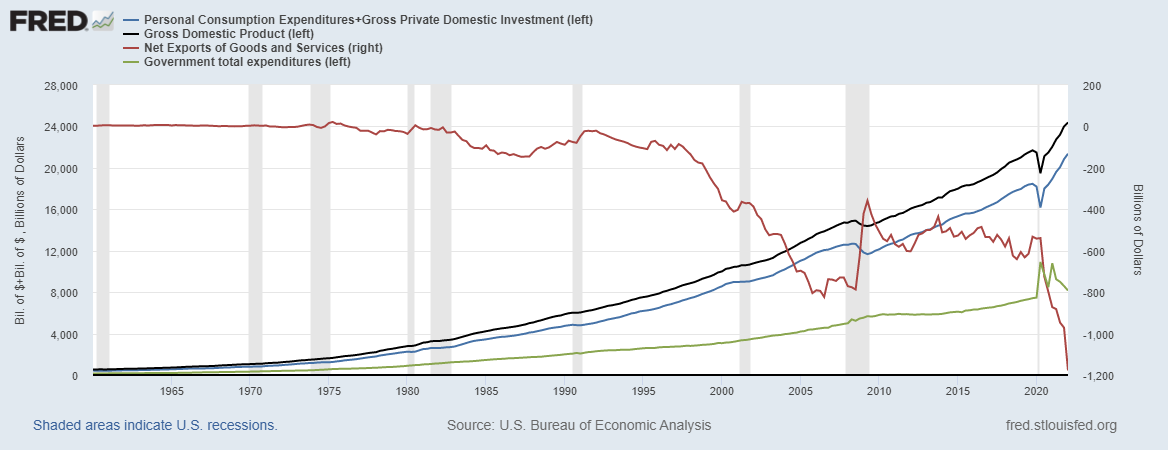
An economy runs a trade deficit whenever it spends more than it earns. The private sector components of spending are consumption (C) and investment (I). Together they make up 88% of GDP as can be seen in the graph below: C + I (blue) is nearly as high as GDP (black). They are 88% as high on average, to be precise.
Notice that C+I basically runs parallel to GDP. And, while the drop in both around 2020 correspond with the spike in net exports, nothing afterwards seems to be driving the rapid deterioration of net exports since 2020.
It’s pretty clear from the next graph that the culprit is government spending. It’s the only thing that spikes upward when everything else drops and the only thing that spikes a second time unlike the other two main components of GDP, consumption and investment.
As was the case before, it’s a little easier to see when scaled by GDP.
Below is a graph of net exports as a percent of GDP and the US federal government’s deficit as a percent of GDP. Unfortunately the Federal Reserve data doesn’t yet include the second spending spike in 2021. But we can see the first spike in 2020 very clearly. It was about 10% of GDP. The largest in US history, at least post World War II when we have the Federal Reserve data.
When the federal government runs a budget deficit – spending more money than it brings in as revenue – and there is a trade deficit, it is called a “twin deficit”[3]. And we usually use that term when we believe the government’s budget deficit is partially or wholly driving the trade deficit as I strongly suspect is the case here.
The Good
Just like for people, for an economy to spend more money than it has as income, it must borrow from somewhere. The best interpretation of this is that “we” the American economy borrowed a tremendous amount of money from the rest of the world. In 2020 and 2021, this was primarily done by the US federal government and a significant amount of that was spent on imports from the rest of the world. That the rest of the world had funds to lend the US government – and ultimately the US people since we pay our government’s bills in the end – and the rest of the world had additional goods and capacity to sell to us.
And in a broader, philosophical sense, we work – selling our services – to pay for the things we buy and so does an economy. Collectively, our exports (sales to the rest of the world) finance our imports (purchases from the rest of the world). So economists usually see purchases as good since we assume people are buying things they want to have. The same would be true here.
It’s always good to have a credit card to carry our excess spending and in this case the world was our credit card. It’s kind of like a store credit card. They both sold us the goods and lent us the money to buy them. And the US really used the rest-of-the-world store credit card to make purchases since 2020.
The Bad
If this were an emerging market, a trade deficit of 5% or more of GDP, especially one that lasts awhile and is driven by a government’s budget deficit would be a sign for concern. It usually signals a crisis coming as everyone lending to the economy becomes increasingly concerned with the economy’s ability to repay its debts.
The US economy is the largest and more prosperous in the world and despite all our problems, it looks to remain in that category for some time. As a result, it’s not as concerning for the US, but if it persists it will be of growing concern.
And a natural question arises here: how much and how long will the rest of the world finance our economy’s excess spending and hence our debt? There is not real answer here. The answer is that it depends on the rest of the world, on the US economy and the markets.
If the US economy were a person, this long-term spending beyond income would mean a huge pileup of debt. The same is true for both government and private debt in the US economy as well. For now we are the best game in town, but the further we continue down this road, the more fragile the scenario becomes.
The sign of problems for an economy facing financial issues is that global lenders begin charging higher and higher interest rates for that economy to borrow. This is nearly impossible to observe for the US economy for two reasons: first, our debt is considered the risk-free asset in most global portfolios and, second, today we are intentionally raising interest rates to fight inflation and so we will pull world interest rates up as well. It’s impossible to see if relatively speaking the world markets see us as more risky.
Of course there are specific markets investors may watch. They might watch US government bond sales and ask “are people still buying our debt” but that too will be a very noisy signal today. The US federal reserve will be tapering it’s own purchases of US bonds and so there will be less demand in those markets for sure.
The other signal might be watching foreign central banks’ purchases of US debt. But with all central banks winding down their purchases too, post pandemic, these signals will be very noisy.
For now, all indications are the opposite actually. Investors continue to buy US debt and actually as the world tips toward recession, investors pour into US debt as they flee to quality. Again, no worries today, but these good conditions for the US economy won’t last and exploiting them just leaves us more fragile to future changes.
The Ugly
The problem is that this all limits our policy scope and unless reversed, leaves the economy ripe for another major financial crash.
The US federal reserve needs to raise interest rates now to fight historically high inflation. But each increase in the interest rate, raises all the market rates and that raises the costs of borrowing for everyone in the economy, including the government. So if this decline in net exports – which requires us to borrow from the rest of the world – continues, then the cost of borrowing will start to crowd out other expenditures. That is, more and more of our personal income will have to be devoted just to repaying debt and interest on debt.
That debt-cost problem will cause the Fed to be more cautious in its policy response to inflation. A little inflation makes all this easier. It lowers the cost of repaying debt a little bit because each dollar we have to repay is worth a little less over time and our debt is in dollars, so its value is a little less. This gives the Fed just a slight incentive to leave inflation and keep interest rates a bit low while we repay debts. But that only works if you don’t also pile on more debts. That’s one reason I hope the US Congress is pressured not to add more spending fuel to the economic fire at this point.
There is an additional issue at play today. That is the US dollar relative to other currencies.
Global investors chase returns. Whatever country and market is offering higher returns (for the same risk), that’s where they want to invest their money. Today, the US economy is still looking strong relative to the rest of the world. And we are raising interest rates before others like Europe are. That raises the returns to investing the US relative to other markets. So there has been growing global demand for US dollars in recent months.
A stronger US dollar means Americans can buy more foreign goods for cheaper. That drives up imports! And US goods will feel more expensive for foreigners, driving down exports. That, combined with a global economic slowdown suggests the trade deficit will actually worsen for a while still.
The ugly side of all this is the set up for the adjustment. A trade deficit that’s 5% of GDP with an already heavily indebted economy, is a recipe for disaster. Any policy move has amplified costs and is limited in scope because repayment becomes a priority.
We aren’t over the cliff yet, but the continued deficit is worth watching. All the pressure is on it getting worse before it gets better but it is unsustainable and will have to be addressed eventually.
[1] For those who remember their Econ 101, the national income identity is Y = C + I + G + NX. So those first three (C + I + G) are the domestic uses of GDP and NX captures trade with the rest of the world. A negative NX (net export) number. Those with more economics education will notice I’m fudging a little here because the true measure of aggregate income for an open economy would be “gross national disposable income” and then we could look at the current account instead of NX, but the fundamental points here come through either way and I chose the less technical route.
[2] Technically it’s “goods and services” which isn’t of major importance, but it is worth noting that the US usually runs a deficit in goods but a small surplus in services. But writing “good and services” everywhere gets wordy.
[3] Technically “twin deficits” are usually considered to be the government budget deficit and the current account deficit. The current account accounts for both the net exports in goods and services and in other factors, the biggest being financial returns paid to the rest of the world. But the current account is largely driven by net exports, so I blur the distinction here.


