US Inflation and News Update

Consumer Price Index (CPI)
The official US CPI report, aka “the inflation report”, came out on August 10th (link)[1] and it was silver lining in otherwise darkening economic storm clouds.
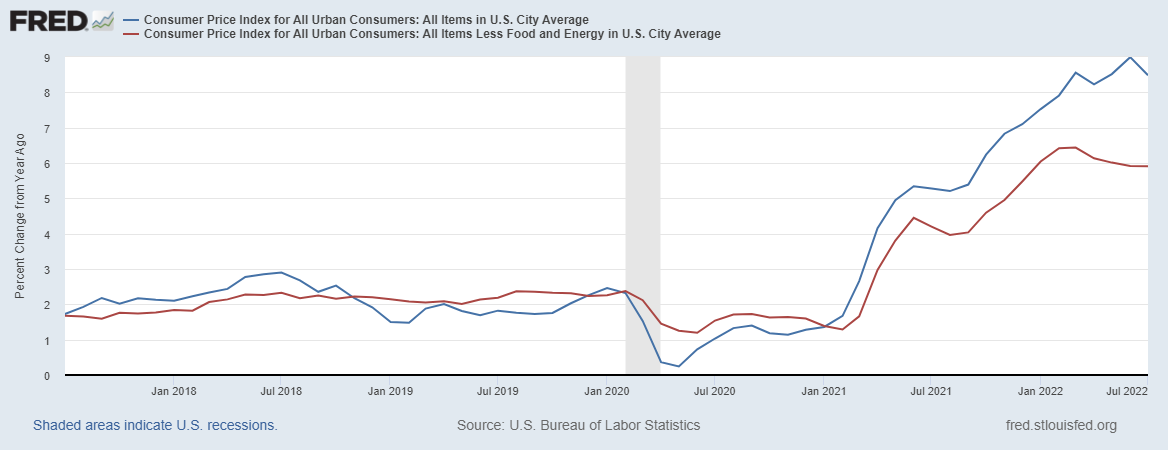
Annual inflation fell from 9.1% in June to 8.5% in July. 8.5% is still a 40-year high, but after 9.1% it’s at least a movement in the right direction. Most of the change came from gas and energy prices falling.
Global gas prices have fallen by about 25% during the summer after a spike following the start of war in Ukraine. Global Brent crude prices have fallen over that same period by about 20% as well. That’s good news and helps everyone at the pump, so to say.
It’s likely that energy prices are just normalizing after the initial Ukraine War fear and could spike back up if things worsen. Indeed Russia is reducing energy supplies to Europe as I write this and halting supplies via the Nord Stream pipeline for unexpected maintenance (again). So, the situation is still very volatile.
Even in normal times, the volatility of energy prices is one reason the Fed doesn’t usually look at them when looking at “inflation”. The thinking is precisely that they swing too much – i.e., are too “noisy” – to be a reliable indicator of the inflationary implications of Fed policy. So, while good news for us as consumers, this top-line CPI number didn’t say anything about the Fed’s inflation fight.
Indeed, while energy prices fell during the summer, they are still over 40% higher than last year. But let’s be gracious. If they continue to fall over the coming month or two, it will be a trend and a good one at that.
Painful Inflation and Core Inflation
Annual inflation for people’s groceries – the BLS’s “Food at home” category – was 13.1%. That’s still very painful. Food at home prices have risen 1-1.5% each month this year and the July increase was 1.3%. They show no sign of cooling off at all.
In addition to energy prices, the Fed considers food prices too volatile or noisy as well. The Fed prefers a “core” number that excludes both food and energy. That core number did improve this month.
Annual inflation for the Fed’s core inflation measure – “All items less food and energy” – was 5.9%. That is down from the 6.4% in June and that, if anything, is an indication that the Fed’s anti-inflation policies are having an effect. The decline was largely driven by a decline in the monthly prices for “Used cars and trucks” (-0.4%), “Apparel” (-0.1%) and “Transportation services” (-0.5%).
I don’t know much about apparel and transportation services, but I do know used car prices spiked during Covid due largely to supply chain problems causing shortages in new car production. Hopefully this month’s report was an early sign of that market normalizing.
The FRED graph shows the overall inflation rate in blue and the Fed’s core measure in red. The core number peaked in March and has been declining a little each month. The Fed’s target for that number is 2%. It’s still at 5.9% so we aren’t there yet, but it looks like it’s moving in the right direction and that headline inflation (the blue line) is slowly starting to follow as well.
Let’s keep our fingers crossed and watch for next month’s number.
Producer Price Index
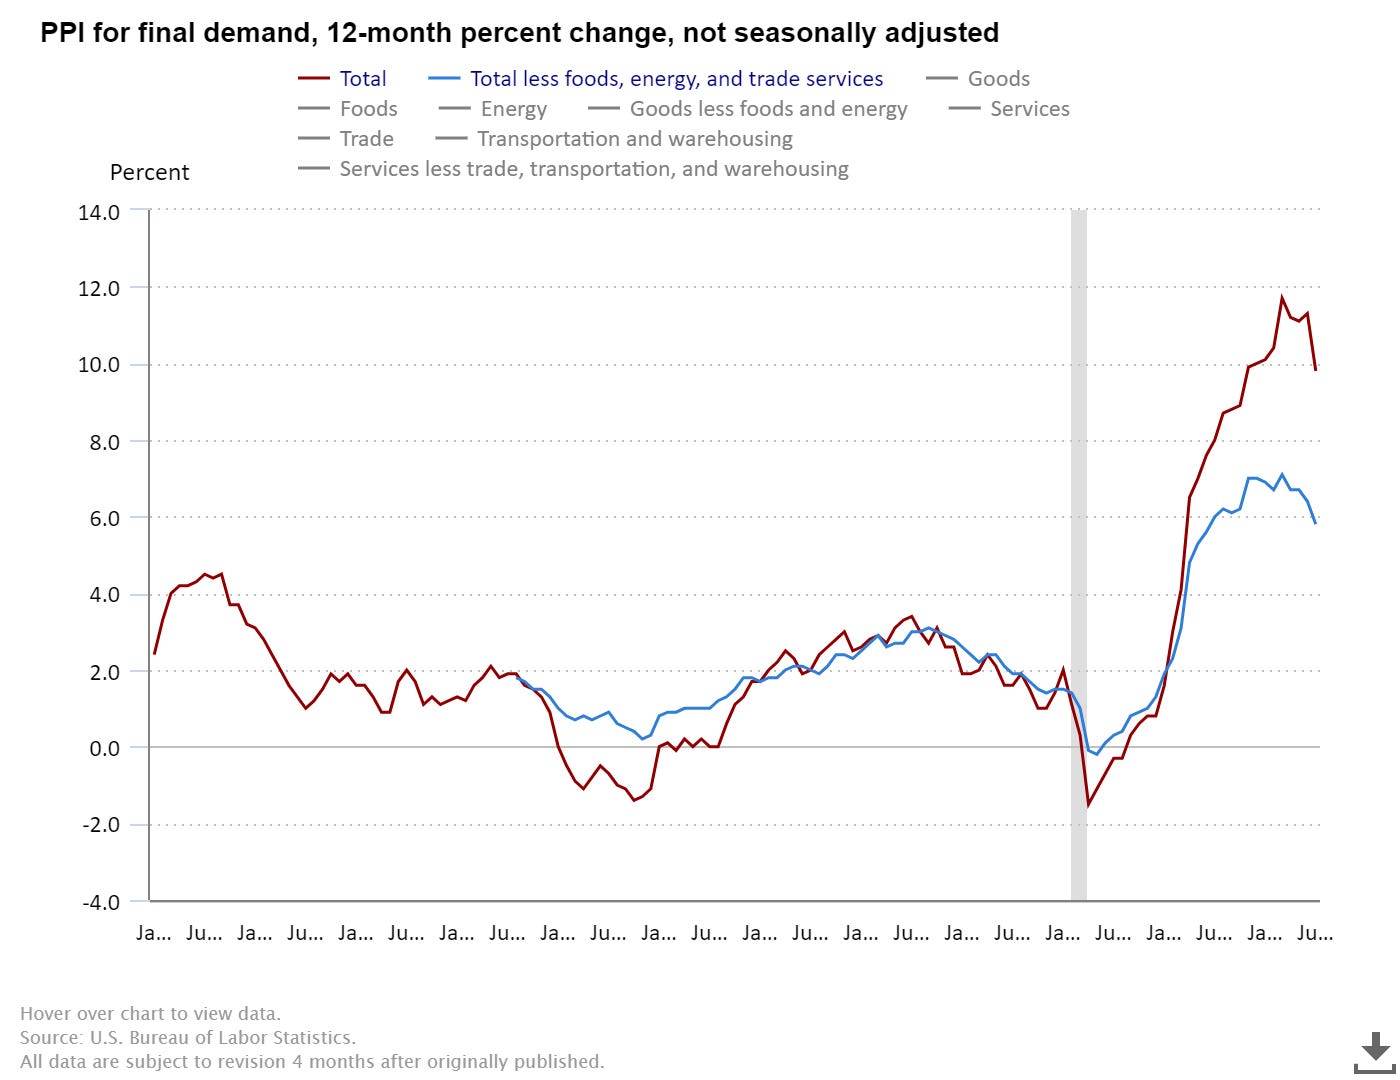
The Producer Price Index was released August 11th, and was even more positive than the CPI report. This measures the inflation of the prices that producers, i.e., companies, pay to buy their inputs. It was 10-11% all yearlong and most estimates thought it would stay there.
It was 9.8%! That’s a huge drop considering it had been 11.2 in April, 11.1 in May, then 11.3 in June and… 9.8 in July! That was good news.
Again, the big driver was energy which dropped 9% over the month and is an important input for most businesses. If it persists, it means companies will have a little less pressure to raise their prices. And that feeds into less consumer price inflation eventually.
The BLS’s own graph tells the story pretty clearly. The red line is total, or “headline PPI” and the blue line is “core PPI” which excludes food, energy and trade services. Again, core PPI, like core CPI, has been stable and decreasing lately. The headline PPI seems to be following. The gap between them seems clearly due to the Ukraine war and subsequent energy price spikes. The gap looks like it’s closing.
Overall Inflation Assessment Today
Overall, my assessment is that the economy has been cooling off and inflation pressure is easing. It is just one month’s report, but it’s good news. If it keeps up, then we could be at 4-5% inflation next year and 2% by 2024.
At this point I am still expecting a 0.5 to 0.75 point interest rate increase at the next Fed policy meeting. That will be September 20th-21st. We’ll have more reports before then to help us see if this is a possible trend or just a blip.
Essentially, I see nothing today to suggest the Fed will change its current path. If inflation and the economy continue to slow through their September meeting, then we can reassess.
The warning is that the improvements in the headline numbers are coming from lower energy costs. That’s volatile and could move the other way if Ukraine-War-related actions worsen. But, let’s take the good news as such and hope for continued improvement.
The Inflation Reduction Act: A Note
In the meantime, Congress passed the “Inflation Reduction Act”. I was asked to do a short TV interview CT Eyewitness 3 News: story here (I don’t know if the video is still there).
They asked to comment specifically on where and how the average person might see the effects of this inflation reduction act on the prices they pay in the stores, etc.
I try very hard, especially when I’m on TV, to give a “here’s the good and here’s the bad” kind of answer. I want people to continue to listen and I don’t want to be partisan. I always look for some silver lining and then make my points. My belief – perhaps unfounded – is that people might listen if I’m not just attacking everything.
In the end, after spending an afternoon reading about the legislation, I couldn’t find and still I can’t find a single thing in the bill that has any effect on inflation today. And where it might have some effect, it will increase government-financed spending in the economy on targeted goods and industries. That will make prices rise in the short term and worsen productivity in general.
I should also note that the version of the bill I commented on still included price caps on insulin and agreement that the US Government would negotiate down a set of prescription drug prices. So clearly people buying insulin and those drugs will pay less and will privately benefit. But price controls create a whole other set of problems. You can find my comments on Price Controls in earlier posts.
Government Subsidies Don’t Lower Prices
Additionally, in the cases where the government just subsidizes the purchase of something, the total price may not change initially at all. The consumer just pays less of that sticker price privately. So that doesn’t affect inflation at all and over time, by making something feel more affordable for individuals, it raises demand and actually raises the total price.
I only add that comment because I head some TV commentators comment that at least the bill lowers “inflation” for middle and upper class people buying solar panels, EVs, and premium energy saving devices. But that’s incorrect. A subsidy just means the person buying the good doesn’t pay the full sticker price.
It is correct to say that, initially, people buying these things will privately benefit from having a lower out-of-pocket payment. Again… no effect on inflation or a long-term negative economic effect of inflating demand and hence prices for those subsidized goods.
Whether it has an effect on the environment, climate, etc., I leave for other experts in those fields to explain. My focus is just on the economics.
[1] BLS Summary Release: https://www.bls.gov/news.release/cpi.nr0.htm


