
Biden and company blame inflation on greedy corporations and Putin. The Republicans blame Biden and the Fed. The Fed blames supply chains and the pandemic. Talk about a circular firing squad.
The answer to who is actually to blame is strikingly obvious to anyone if they look at two simple pictures.
The first is government expenditures.
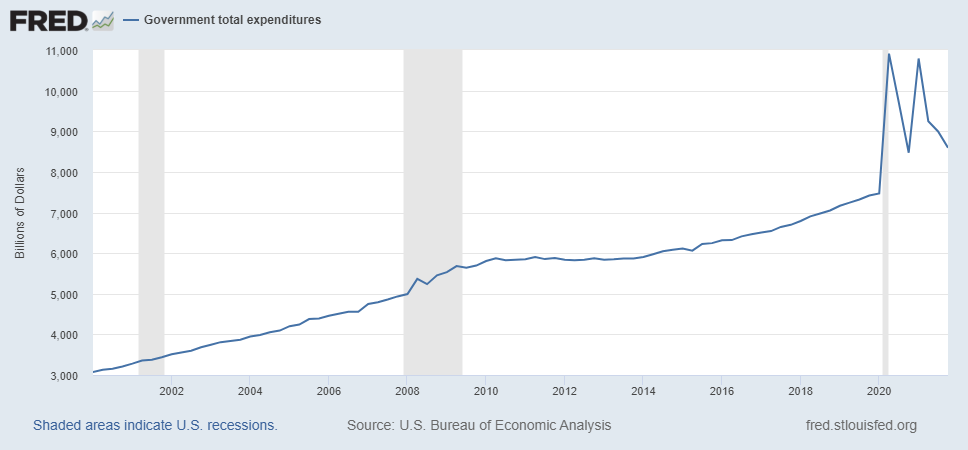
The Federal Reserve’s St. Louis office has a great database called FRED. Anyone can type in Government Expenditure and they’ll find the above graph. Actually, they’ll find one going back to 1960 which makes our current spending look even worse than this graph which only goes back to 2000.
You don’t have to be an economist to understand that the spending we did since 2019 is way out of the bounds of normalcy. The two massive government spending packages jump out at the end.
The shaded areas represent recessions. The first one is around 9/11 and doesn’t even register anymore in this graph although you might recall the war spending that followed which seemed pretty extravagant at the time. Next is the great financial crisis or “the housing crisis”. That too broke records and was large enough even by today’s standards to still appear on the graph. We grew government spending at about 10% for four solid quarters in 2008 and 2009 to help fight the recession.
Neither 9/11 spending nor 2008 spending compare at any level with what we did since Covid.
That first Covid spike was a 50% year on year increase in total government spending. The second spike was another 44.4% year on year increase in 2021, well after our economy had recovered.
And how was that financed? Well a second picture answers that question pretty clearly. By printing money.
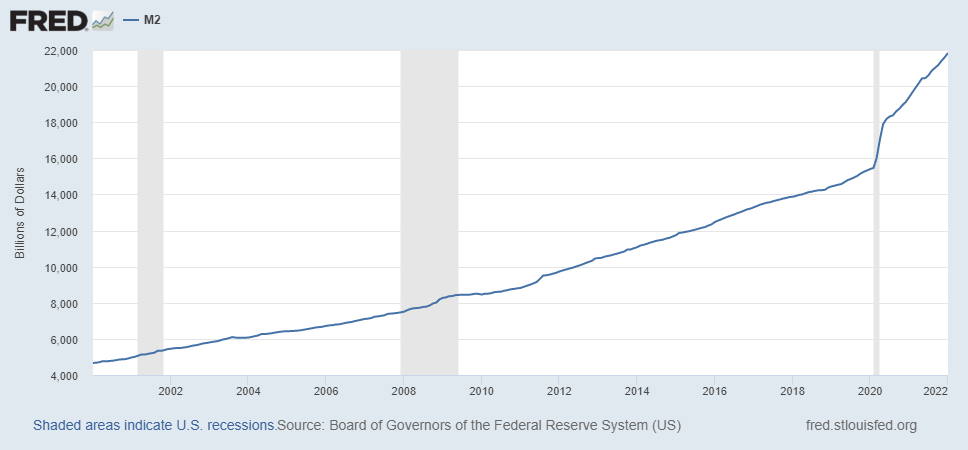
Again, you need no special training to see the increase in the money supply of the United States during the same period and it’s continued growth since then. This picture can be found by anyone looking at FRED data and searching for M2, the common measure of the money supply. You’ll get a picture going back to 1980 this time which, again, only makes the recent aberration stand out more.
Many of us remember being horrified at how much money was pumped into the economy during the housing crisis of 2008/09. But it’s hardly a blip in comparison with what we’ve done over the past two years.
And notice that it does increase around 2009 but immediately flattens. That’s because during the housing crisis, the Fed quit expanding the money supply as soon as the economy recovered. We didn’t do that at all this time as you can see by the continued upward path of money.
Historically our money supply grew at about 7% annually. In the 1970s and early 1980s we let it get out of control and money grew 10-13% for a while. It peaked in February of 1976 at 13.8%, the highest ever on record. During the 1990s it only averaged about 4% growth a year. After 9/11 we pumped extra money in, letting it grow around 10% for a few months, then brought it back to around 7% the following year.
Again, when the housing crisis broke, it was the worst recession since the Great Depression and we still refer to it as “the Great Recession” for that reason. Money was allowed to grow at 10.2% for one month and otherwise averaged 8% in 2009 and only 2.5% in 2010.
Covid was different. The Fed heavily financed government spending and we transferred money directly to households. For 9 months in 2020 the money supply grew between 22% and 25% breaking absolutely all the Fed’s historical records.
The Fed then increased the money supply’s growth rate further in 2021, letting it grow up to 27% for the first three months of the year and averaging 16.6% for the year as a whole. And that was the year after the Covid recession.
It’s no surprise that inflation is 7.9% today. The first spike in government spending was under Trump, the second under Biden. Whether or not either or both were justified, when you money finance that much spending for two solid years, it’s inflationary. Let’s at least be honest about it.
Every politician in Washington and the Fed board of governors are 100% responsible for the 7.9% inflation we are seeing today. Washington over spent and the Fed financed it. The Fed additionally made serious policy mistakes in increasing the money supply way more than justified and then it kept printing at alarming levels way longer than was justified. So the Fed overshot this both in magnitude and in length.
That number doesn’t yet include the war in Ukraine. When we include the spike in food and energy prices in the next consumer price release resulting from the war, that bump can be blamed on Putin. But the 7.9% inflation base… That is unquestionably the result of US policy and the Fed policy mistakes. Pure and simple. And anyone can see it in the Fed’s own graphs.
This is very insightful. A lot of attention is typically centered around the finger pointing between political parties but seldom addresses more systemic issues such as the Fed and their policies. Great statistic highlighting money growth over the decades in response to difference economic environments.