Error Correction. Thanks to a reader who noticed my error in the original column. In an effort to keep the numbers simple in explaining yields, I made a math mistake (one I remind my students not to make!!). Going from 100 to 90 is a 10% change (since 10% of 100 is 10) but from 90 to 100 is actually an 11.11% change (because 10% of 90 is only 9, you need more than 10% to get you to 100. So I modified and added a footnote. The main point remains.
The Wall Street Journal ran a piece this week about the Yield Curve. It’s an excellent piece and I recommend it for anyone interested in this topic. The article was “Wall Street’s Favorite Recession Indicator Is in a Slump of Its Own: Treasury yields have been inverted for the longest stretch on record” (Tuesday, May 28). The concern people seem to have is that the yield curve as a crystal ball for future recessions is broken. My comment is simple: It wasn’t a crystal ball. Nothing broke. People just don’t seem to understand what it’s telling them.
A Quick Introduction to “the” Yield Curve
Loosely speaking, if you pay $90 for a bond today that promises to pay you $100 in a year, it is “yielding” you $10 or 10% over the coming year (technically 11%1) . If you pay $80 for that same bond, it yields you $20 or 20% over the year (technically 25%2).
That’s all the yield is, the return on a bond. When we measure it at the time of bond purchase, as in the examples above, then it is exactly the “interest rate” paid by that bond. So economists frequently use the yield and the interest rate on bonds a synonyms. We’ll do that here (although see this footnote[1] if you want more detail).
The yield curve is just a curve made up of yields on different bonds of different maturities. So, it’s the graph of yields today on 1 year bonds, 2 year bonds, … 10 year bonds and so on.
Yield Curves Generally Rise
If I borrow money from you, you will generally need a higher yield to lend to me for a longer term. Why? Because I’m very likely to be able to repay a 1 day or 1 week loan (after you ensure I have the right income, etc.). But a 5 year loan? Who knows what could happen. There’s more risk involved. You’d need greater compensation for lending me really long term.
That extra compensation is called “the risk premium”. In general, the more risk, the higher the yield or interest required. Car loans, housing loans (mortgages) and credit card loans all come at different rates reflecting, in part, risk. And one particular risk is just time because more and more unknown stuff can happen over time.
As a result, plotting the yields of different maturity bonds will generally make a rising curve because they reflect slightly different risks and generally more risk for longer horizons.
“The yield curve” is a special plot of yields holding risk constant. When we only look at bonds with the same risk, the curve should be flat. It turns out, however, that this “constant risk” curve also rises. No one is truly sure why. Since it shouldn’t rise over time if risk is really constant, any interest rate above the short term rates is considered to reflect a “term premium” meaning that there’s some reason other than risk that people just prefer different maturity lengths.
I’ll give you a quick example. In perfect theory, I can finance my house over 30 years with 30 one-year loans and just roll them over every year or 1 thirty-year loan. For a housing purchase, however, I probably prefer a thirty-year loan to renewing my loan every year if only because the one loan saves me time and effort (called “transaction costs”). You might prefer a 5 year loan for a car, 30 year for a house and a longer-term one for your retirement plan, some other maturity for your kid’s college fund and so on. People have preferences over the maturity of their loans.
That’s all we need to know at this point. In theory, the yield curve should be flat. In practice it is not and it should not be because of risk.
Measuring the Yield Curve
You can plot all the maturities but, in practice, many people look at a quick measure: 10-year vs 2-year rate for constant risk bonds. In theory then, if you subtract the 10 yr rate from the 2 yr rate it should be zero since they should be the same. In practice, it’s positive since the 10 yr rate will usually be higher than the 2 yr.
When it’s positive, it’s called “normal” and when it’s negative it’s called “inverted” meaning the 2 yr rates are lower than the 10 yr rates.
Why It’s Believed Inversion Suggests a Recession Coming
If market participants charge different rates for the same thing, then you can make infinite profits. If bank A charges me 4% on a 2 yr bond and bank B charges 3% on the same bond, borrow from bank B at 3% and lend to bank A at 4% and keep doing it.
The result is that market participants trade across all these bonds and other financial instruments so that interest rates generally move together. Any differences get exploited and quickly disappear. That is, all 2-year rates will rise and fall together, as will all 10-year rates and so on.
Suppose we are looking at the yield curve and imagine that it’s mildly positive which is what it should be in practice. That’s the normal world.
Now suppose a recession is coming in the future. When that happens – in the future – the economy will slow, demand will generally fall and interest rates will fall. Therefore, if everyone believes today that a recession is coming in two years, they will already start trading at lower interest rates on “future” bonds but not current, shorter term bonds, because they believe the rates will be lower in the “future”.
In that case, the short run interest rate, on the 2yr bond, might be constant, but the 10 yr interest rate falls. This can invert the yield curve.
This is entirely possible and seems to be what financial market participants focus on exclusively. They add to this that “historically yield curve inversion always predicts a recession” which is (a) not true and (b) no amount of data can prove something true. So, we’ll move on and focus on the conceptual case.
Interest Rates, Inflation and Non-Recession Reasons for Inversion
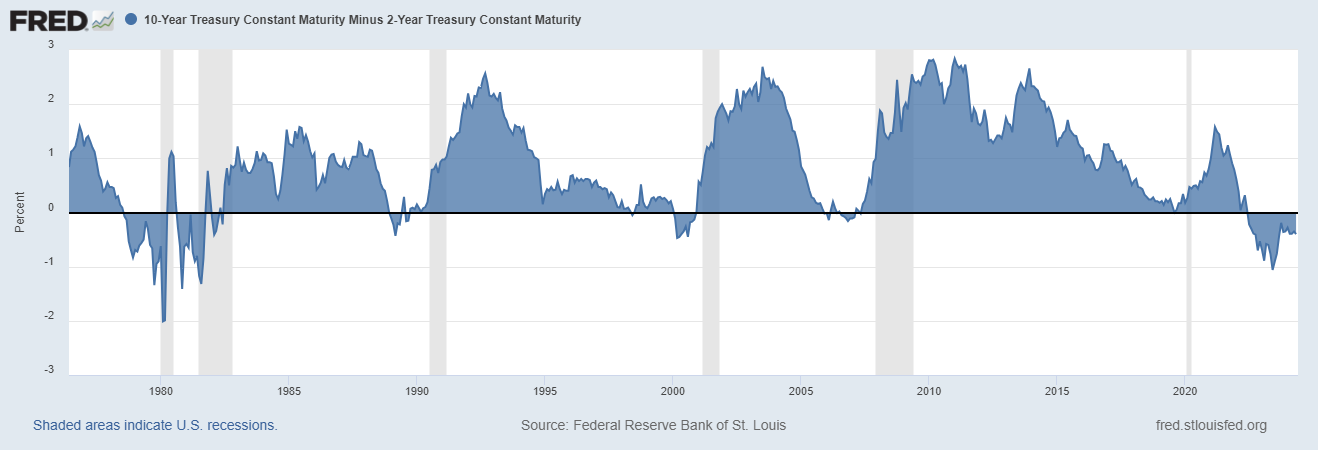
Here’s the yield curve, 10yr – 2yr in the USA from 1976 to today. The grey bars are recessions.
Sure enough, look from left to right. The yield curve turned negative around 1978, two years before the 1980 recession! And again before the 1981/82 recession! And again, two years before the 1990 recession! And in 2000, before the 2001 recession and before 2008! It even turned briefly negative on August 27th, 2019, before the 2020 recession and it’s been negative since 2022 so….a recession must be coming!
Disproving any Causality and even the Narrative More Generally
Let’s dispense with the easy ones first. There’s no way the 2019 dip (which you can’t see here) predicted Covid. It was all over the news when it inverted briefly, but it didn’t last and commentors discussed that it must need to be inverted longer to really signal – they almost suggest “cause” – a recession.
Ignoring that case, the broader narrative isn’t very good either. The pattern they are actually talking is: the yield curve inverting before 1990, then turning positive during the recession – predicting a recovery, I guess – then negative before 2001 yet positive during the recession and again before 2008 but positive during the recession.
But that’s not accurate for the 1980s at all. It’s negative before the recession but stays negative through most of both recession periods. If you want a close up, here’s a link to it in FRED (link).
In any case, seeing an inversion might suggest we should look at other data to see what’s happening, but it certainly doesn’t cause a recession and doesn’t necessarily signal one although one often happens.
But you really only need to look at Fed policy. That totally explains the long inversion today, the massive inversion in the 1980s, every one in between and why it’s not totally related to the recessions, at least not in the same was people seem to think. And, it actually EXPLAINS the likely cause of all the recessions.
The Fed’s Interest Rate Policy Drives the Inversions
When the Federal Reserve (Fed) wants to fight inflation it raises the interest rate today. If it raises it enough, that will cause the yield curve to invert. Period.
To see it, remember we’re looking at 10yr – 2yr. If you hold 10yr constant and just raise the 2yr, eventually this difference turns negative.
And when would you do that? Answer: when you really need to fight inflation.
And, what’s common between the early 1980s and today? High inflation and a Fed trying to fight it.
Here’s the 1976 to 1985 period with the Fed’s policy rate in red and the yield curve (10yr – 2yr) still in blue.
There’s a low point in 1977, then the Fed actively raised its policy rate causing the yield curve to become less and less positive. You can see interest rates rise more at end of 1978 and push the yield curve to invert. Rates rose and rose, driving the yield curve further and further into inversion.
Then, in early 1980, they cut the policy rate, pushing the yield curve briefly positive and then did what? Raised it dramatically again from around 8 or 9% to 18% or so, driving the yield curve negative again.
Then, mid 1981/82 recession, began lowering interest rates as inflation began to fall (not graphed here). That drove the yield curve back into positive territory.
What about the 1990 Recession?
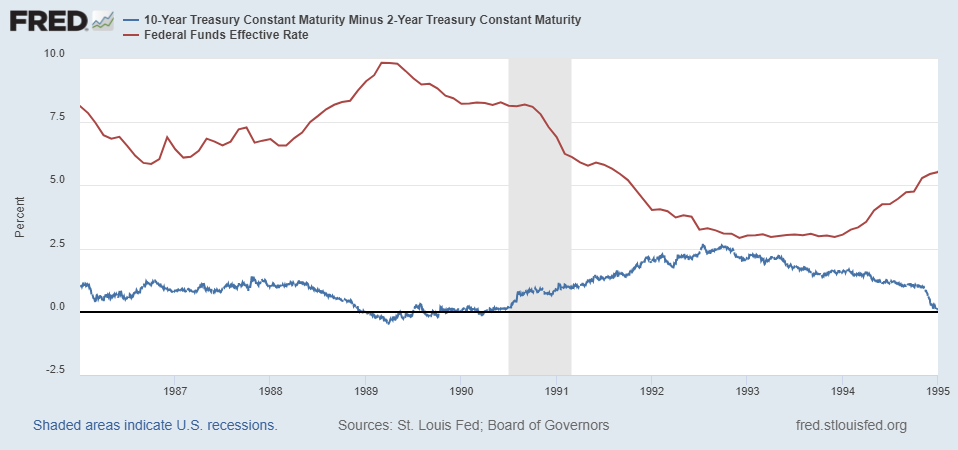
We can see that from looking at the 1985-1995 period quite clearly.
Again, the Fed actively and intentionally raised the policy rate – which is designed to influence short term rates, incidentally – and drove the yield curve to invert. It lowered them a bit as we neared 1990, the yield curve turned flat then positive again and remained there as the Fed cut rates during the recession and afterwards.
The Other Recessions Look The Same
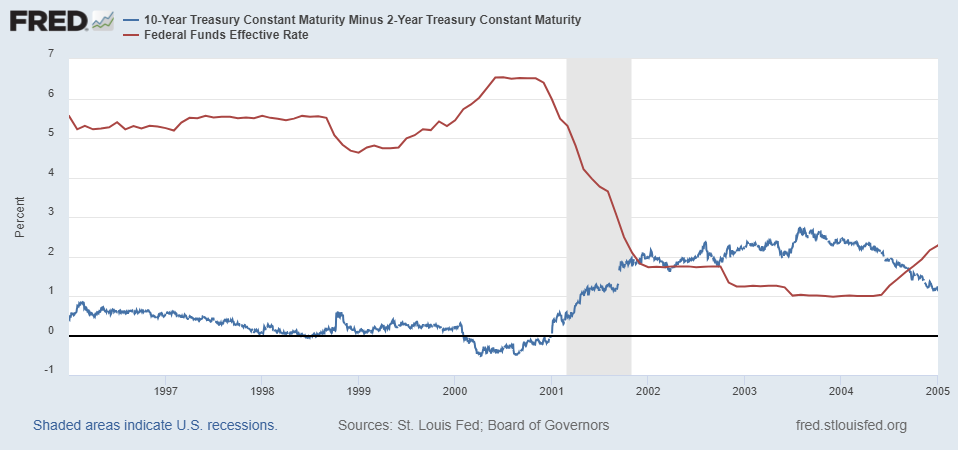
Here’s the 2001 Recession: Pretty clear once again!
And 2008: Very clearly raised interest rates and drove an inversion.
Finally, we come to today. What has the Fed been doing since 2022? Answer: Fighting inflation by raising short-term interest rates. (Note: In this, zoomed-in graph, you can even see the little blip in 2019 I mentioned. And what drove that? Same thing.)
Why is anyone surprised at all that in 2022, right when the Fed raised short-term rates dramatically, that again the yield curve turned negative? And we’ve kept interest rates higher for longer and the yield curve has accordingly stayed inverted for longer.
Causality and Credibility
We know for sure that the Fed’s rate hikes are policy choices. They are active decisions by the Fed. We also know that the yield curve is made up of market interest rates. So, it seems abundantly clear to me that the Fed’s policy rate is the one you should watch and the yield curve just responds to it.
Additionally, we know that the Fed’s intention and belief is that raising rates slows the economy (by slowing/reducing aggregate demand). If you slow the economy enough, it’s a recession.
If anything, then, the Fed’s policy decisions are driving recessions and should be the thing to watch.
Now, the yield curve might tell us something informative about market belief of long-run inflation. The deeper and longer inverted yield curve tells us that long-term inflation expectations are well anchored.
Suppose we are at 2% inflation and in a healthy economy so interest rates are maybe 3% (real rate = 1% and inflation = 2%). If everyone believes inflation will rise and stay high over the coming years then long term rates will drift up – reflecting the higher expected future inflation – and this will make the yield curve more positive (i.e., raise 10y but keep 2y constant).
Now suppose we are at 2% inflation and we get inflation today. The Fed will raise short term rates and the curve will invert very dramatically.
If, throughout the inflation fight, the Fed maintains its credibility and everyone believes we’ll get back to 2%, then long run rates don’t move much but the yield curve will invert as the Fed raises short term rates. We’ll have high short term rates (trying to fight today’s inflation) and lower long term rates (reflecting the belief the Fed can do its job and get us back to 2%).
What if, mid-way through the inflation fight, we lose confidence in the Fed? Then while short term rates are high, long term rates will also start rising to reflect expected higher inflation in the future and the yield curve could move closer to zero and even positive. And that would be a really bad sign.
So, in our case today, if the Fed is credible and everyone believes inflation will return to normal (i.e., 2%) then the yield curve should be inverted all during the inflation battle. That it’s still inverted today just suggests the battle against inflation isn’t done but everyone still believes the Fed will win the fight.
Raising Interest Rates Should Cause Aggregate Demand to Fall
Central banks raise policy rates in order to lower aggregate demand which slows the growth rate of and may even lower the level of GDP. That would be a recession.
The yield curve is telling us something interesting about expectations of inflation. And it’s being negative for so long should be seen as confidence in the US Fed to fight inflation successfully. That inflation fight may also cause a recession or not. It usually does. But that has nothing to do with the yield curve.
Thank you for reading.
[1] After it’s been purchased at, say $90, for the 1 year $100 bond, you have locked in the 10% yield. But the next day something could happen in the market so the price changes and the yield can change (say the price falls to $80). But your bond would still yield you 10% but the market interest or yield on that bond would now be something else (20% in this example). And because you can trade across markets, there can be a difference between actual market interest rates and yields.
ERROR Correction: The original article only had 10%, but 10% of 90 is only 9 and 9+90 only gets you to 99, 11.1% of 90 is 9.9999…= $10.
ERROR Correction: The original article only had 20%, but 20% of 80 is only 16 and 16+80 only gets you to 96, 25% of 80 is $20.


Thank you. Yes, you are 100% right. Thanks for catching this. It'll correct it now. In trying to keep the numbers simple, I forgot to think! Thank you.
If you buy something for $80 and sell it for $100, that's a yield of 25% (= $100/$80 - 1). If that's over two years, that's an annual yield of 11.8% (= 125%^.5 - 1).